Full-Duplex Interaction Track Results
1. Task Dimensions and Evaluation Methodology
The final score for this challenge track is derived using an automated evaluation script, details of which can be found in Full-Duplex_Interaction_Evaluation. The Total Score comprises three components: the Interruption Total Score, the Rejection Total Score, and the Total Delay Score.
- Interruption Total Score: Calculated as the average score of the Chinese (CN) interruption test set and the English (EN) interruption test set.
- Rejection Total Score: Calculated as the average score of the Chinese (CN) rejection test set and the English (EN) rejection test set.
- Total Delay Score: A relative score derived by remapping each team’s Total Delay based on the performance distribution across all participants and the baseline system. The exact mapping rule is specified by the formula below.
$$\text{Score}(L) = 100 - 40 \times \frac{\log \left( \frac{L}{L_{\text{min}}} \right)}{\log \left( \frac{L_{\text{base}}}{L_{\text{min}}} \right)}$$
where $L_{min}$ represents the minimum latency among all participating systems, and $L_{base}$ represents the latency of the baseline system. The total delay score of the baseline system is defined as 60.
It is important to note that system latency can be affected by hardware variations. To ensure fairness, we collected Docker images from all participating teams and conducted official testing on the challenge test sets under controlled conditions, using identical, idle machines (RTX A6000). The latency obtained from this official testing were used as the final system latency for each team.
2. Final Total Score Calculation Formula
The Final Total Score is a weighted sum of the Interruption Total Score, the Rejection Total Score, and the Total Delay Score. The calculation formula is as follows:
$$\text{Total_Score} = \text{Interruption_Total_Score} \times 0.4 + \text{Rejection_Total_Score} \times 0.4 + \text{Total_Delay_Score} \times 0.2$$
3. Results
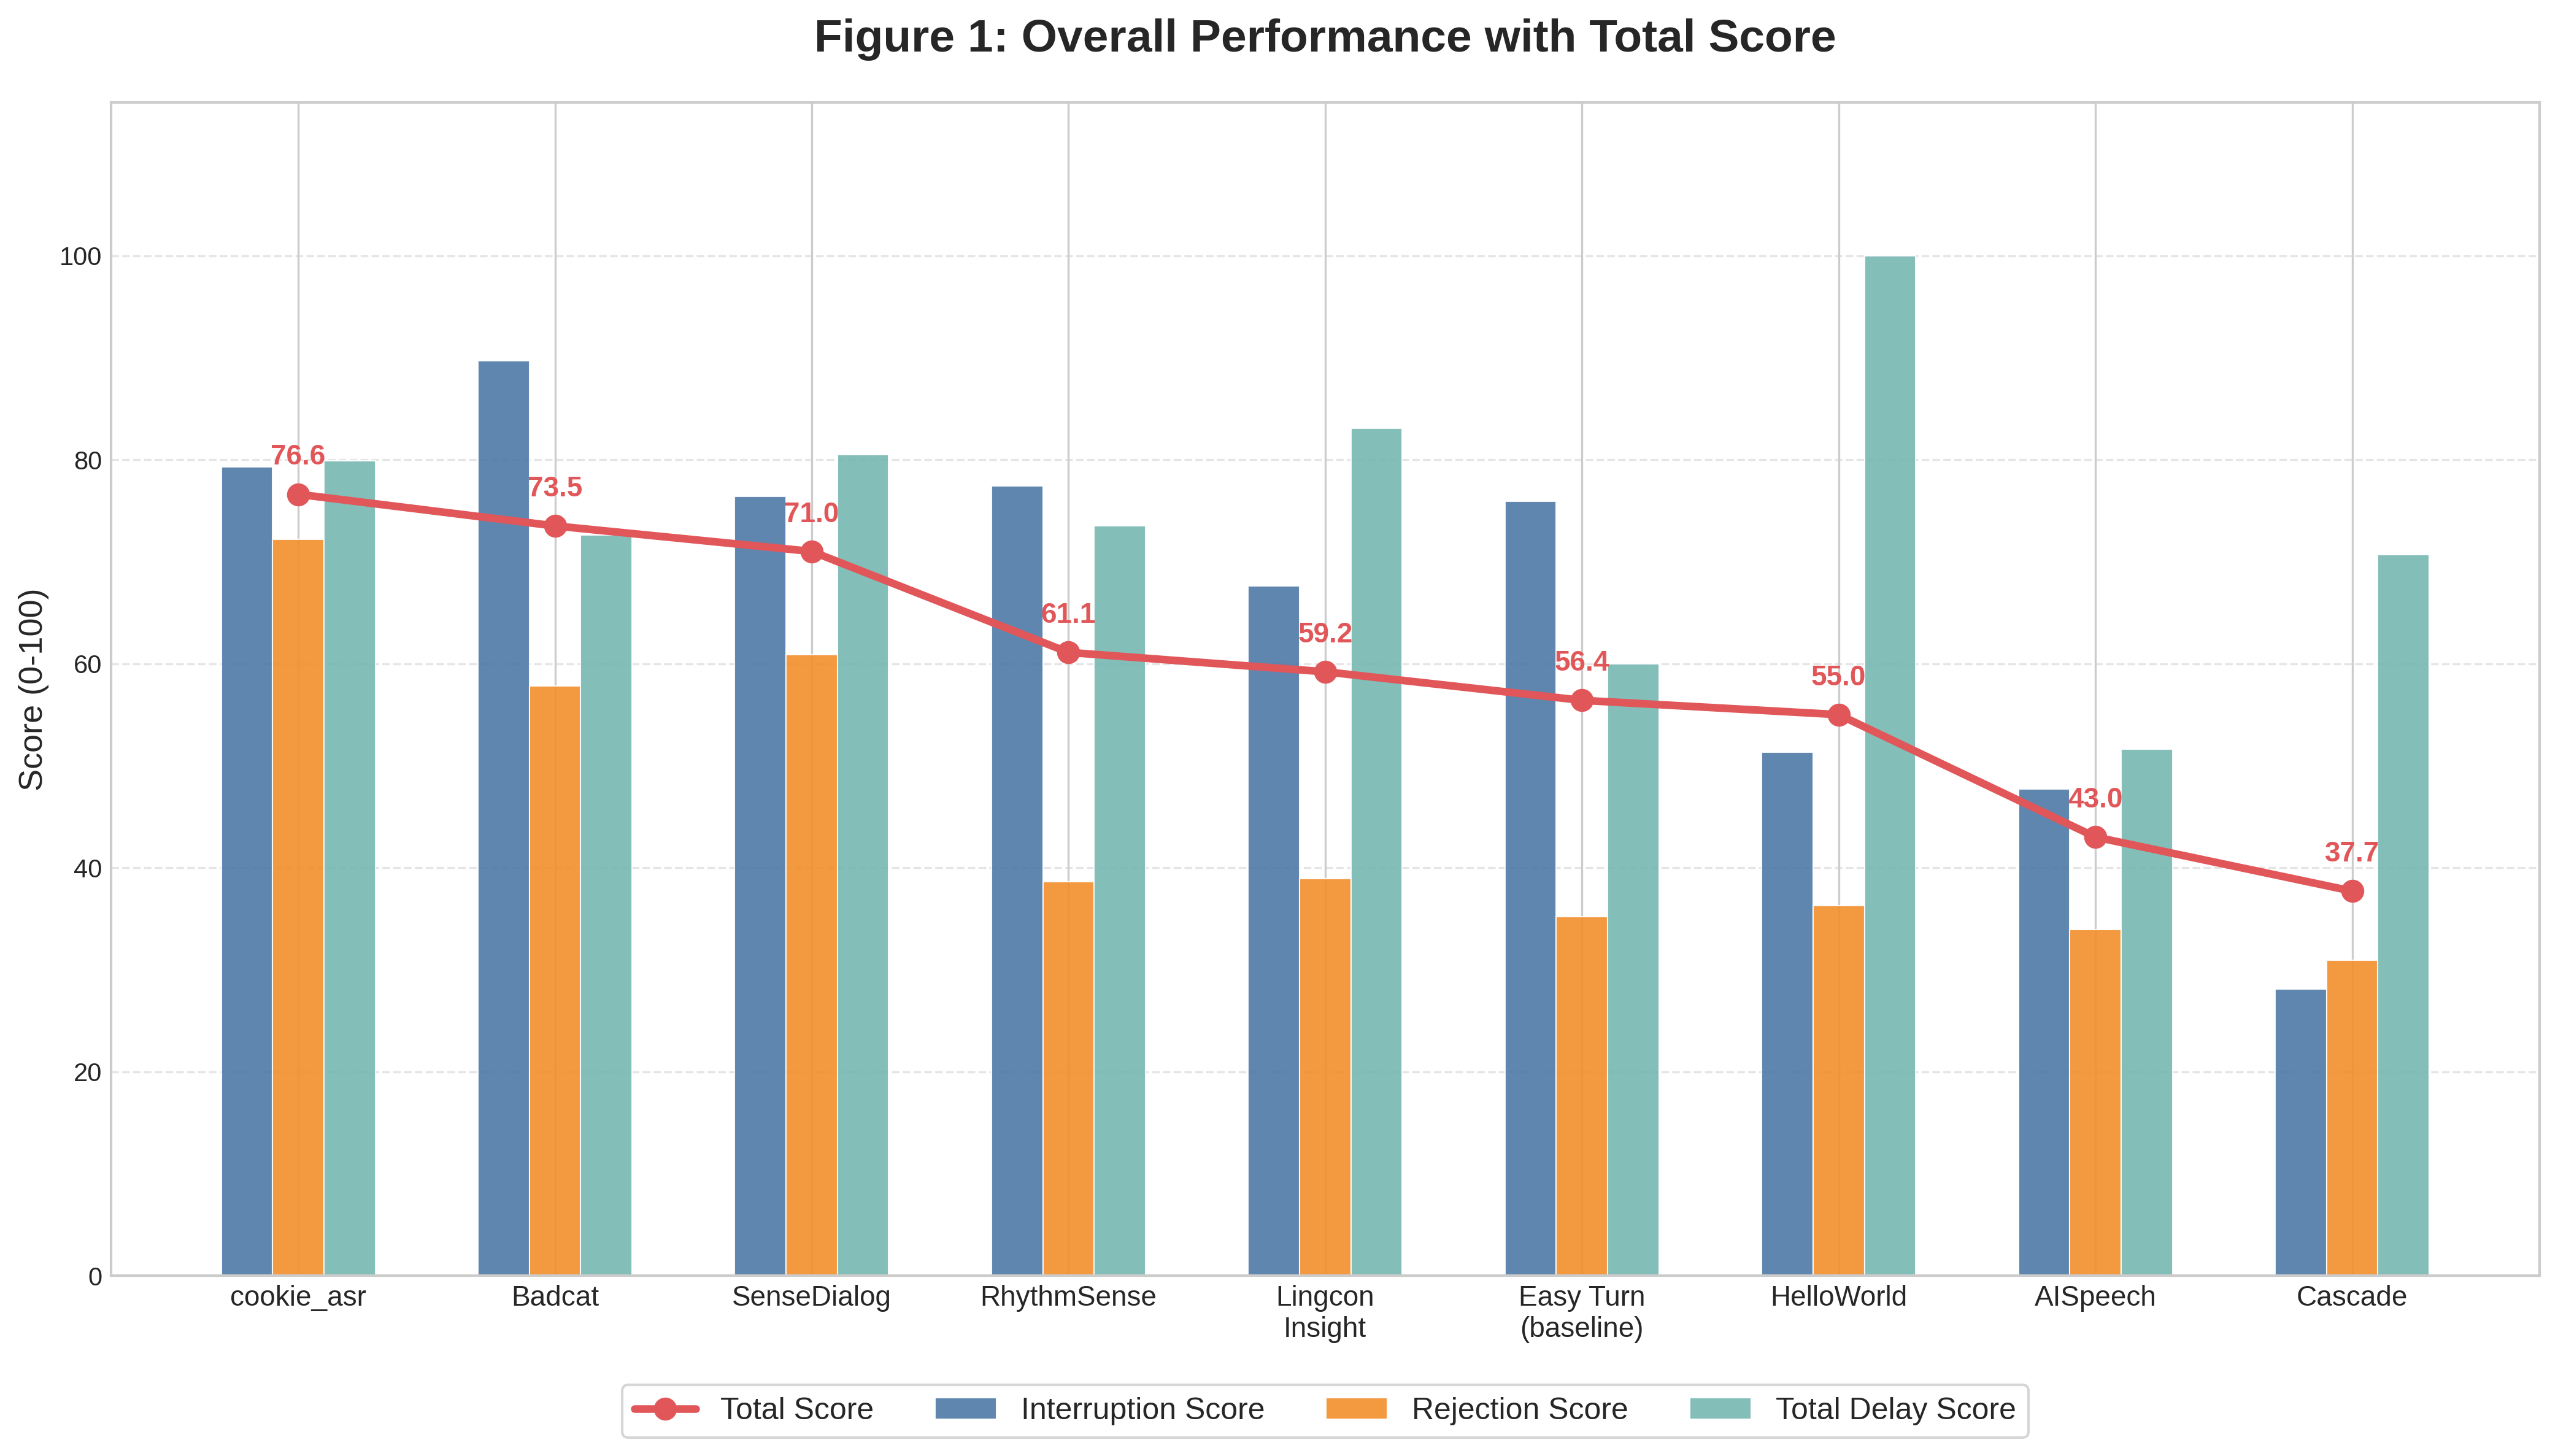
A total of eight teams submitted their results and system descriptions for this challenge. The scores and rankings of each team are presented in Table below, and the visualized results are shown in Figure 1.
| Team | Interruption Total Score | Rejection Total Score | Total Delay(s) | Total Delay Score | Total Score | Ranking | ||||
|---|---|---|---|---|---|---|---|---|---|---|
| CN | EN | Total | CN | EN | Total | |||||
| cookie_asr* | 81.8 | 76.8 | 79.3 | 74.5 | 69.8 | 72.2 | 1.260 | 79.9 | 76.6 | 1 |
| Badcat* | 92.6 | 86.8 | 89.7 | 56.5 | 59.0 | 57.8 | 1.632 | 72.6 | 73.5 | 2 |
| SenseDialog | 81.2 | 71.6 | 76.4 | 56.3 | 65.5 | 60.9 | 1.237 | 80.5 | 71.0 | 3 |
| Unity Squad | 85.6 | 51.4 | 68.5 | 60.1 | 42.3 | 51.2 | 1.876 | 68.6 | 61.6 | late submission |
| RhythmSense | 81.8 | 73.0 | 77.4 | 41.0 | 36.1 | 38.6 | 1.577 | 73.5 | 61.1 | 4 |
| Lingcon Insight | 76.0 | 59.2 | 67.6 | 45.1 | 32.6 | 38.9 | 1.127 | 83.1 | 59.2 | 5 |
| Baseline | 90.8 | 61.0 | 75.9 | 36.8 | 33.6 | 35.2 | 2.531 | 60.0 | 56.4 | 6 |
| HelloWorld | 57.2 | 45.4 | 51.3 | 36.1 | 36.5 | 36.3 | 0.624 | 100.0 | 55.0 | 7 |
| AISpeech | 66.0 | 29.4 | 47.7 | 37.1 | 30.6 | 33.9 | 3.391 | 51.6 | 43.0 | 8 |
| Cascade | 24.8 | 31.4 | 28.1 | 24.1 | 37.6 | 30.9 | 1.739 | 70.7 | 37.7 | 9 |
*: invited to submit ICASSP 2-page papers.
4. ICASSP 2-Page Papers
According to the grand challenge official rules, the top 2 teams in this track (cookie_asr and Badcat) are invited to submit papers (2 pages main content + extra page with refs) to the ICASSP 2026 Grand Challenge Track.
- Specific submission instructions will be emailed separately to the qualifying teams.